
If you’re honestly interested in digital marketing and looking for ways to improve brand awareness and visibility, then being active on social media is no longer optional; it’s essential. Whether you’re running a startup, an influential creator, a vlogger or a brand seeking audience attention, consistently sharing content on social media is a must.
While likes and comments may give you a quick overview of how your posts are performing, they offer a limited view of performance. To truly understand performance across every social platform, you need deeper and more reliable analytics.
Social media analytics offers insights to help you evaluate the effectiveness of your social media strategy. More importantly, they allow you to make informed decisions rather than relying on guesswork.
Among the most important social media metrics, you should focus on reach, impressions and social media engagement. These top value-driven metrics can significantly boost your social media marketing efforts when tracked optimally.
Let’s explore how each of these metrics works with clear examples, so you can start using them effectively!
What Are Social Media Metrics?
Social media metrics are data indicators that track and measure your content’s performance across social media platforms. They help you analyze the impact you’ve made on social channels and evaluate the effectiveness of your strategy using analytical metrics such as reach, likes, impressions, shares, engagement and view rate, helping you determine progress toward achieving overall business goals.
Social media metrics also help you refine your strategy, optimize content based on the reports you gather and enhance future content for better engagement each time!
What Is Reach on Social Media?
Reach is one of the most important metrics for understanding how far your content is reaching your audience. Measuring this metric helps you determine the total number of users who have seen your social media content.
For example, if you share a reel with a call-to-action or link annotations, the Reach metric counts how many unique viewers opened and watched the reel. Suppose your reel is displayed 600 times on screen and 500 viewers actually open and watch it; in this case, your reach would be 500.
Some platform algorithms boost visibility by showing posts multiple times to the target audience. Platforms like Facebook and Instagram often follow this approach.
So, how to improve social media reach? To improve your reach, repetition is key; the more often your post appears in your audience’s feed, the higher your Reach metric will grow.
To make your content more effective, keep your posts short, crisp and relevant, avoiding excessive promotional elements. A clear, engaging narrative combined with smooth conversion techniques can encourage greater interaction.
As your audience begins to resonate with your content, your potential reach expands, maximizing engagement and increasing the overall value of your impressions by creating greater opportunities for reach.
Impressions are also an important metric and it’s connected to reach; hence, it’s essential to monitor the Impressions: Reach ratio for a better understanding of your performance report. This ratio gives you insight into how many times your posts or ads are being shown to your target audience and helps identify the point at which engagement starts to gain momentum.
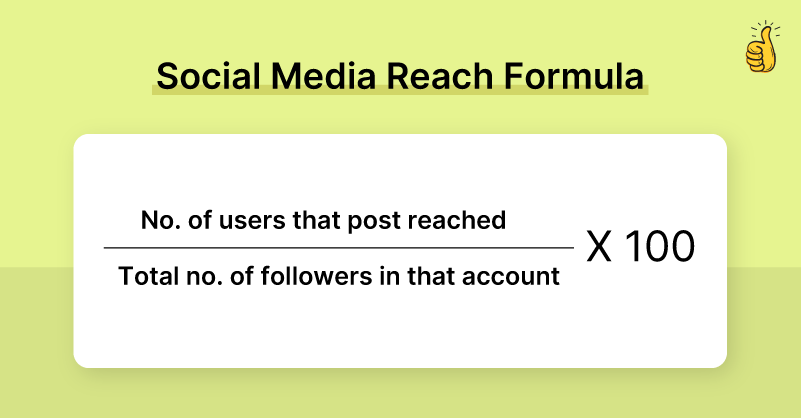
The Formula to Calculate Social Media Reach
What Are Impressions on Social Media?
When it comes to social media posts, the impressions vs reach are different from each other, even though the two are closely connected. Impressions measure the number of times a post appears on your audience’s screen. This helps indicate how visible or popular your content is by showing how often people encounter it in their feed.
If you want to track impressions, keep in mind that not every platform highlights this metric in its analytics. Some social media management tools, like GudSho Social, Buffer and Buffer alternatives such as Hootsuite and Sprout Social have dedicated sections for impressions, making it easier to monitor without manual calculations.
For example, TikTok and Instagram don’t always display impressions directly but may offer equivalent metrics, such as total content appearances or total video views.
Measuring impressions is important because it shows the potential visibility of your content on social media, but it alone doesn’t tell the full story. If your goals include improving brand visibility, awareness or authenticity, it’s best to evaluate impressions alongside engagement and conversion metrics. This approach gives a clearer, more complete picture of your social media performance.
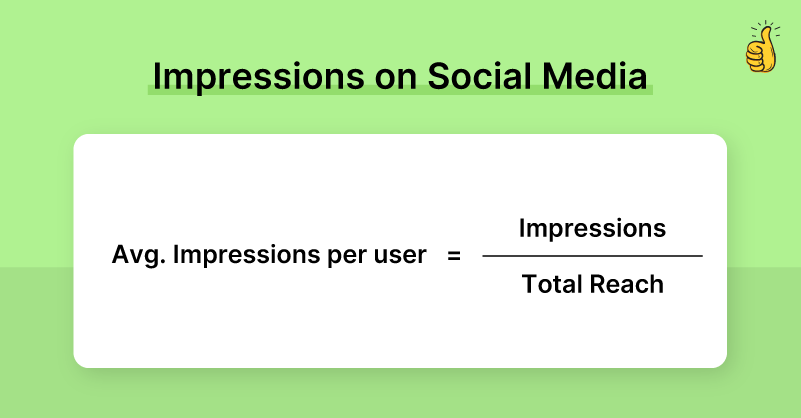
The Formula to Calculate Impressions on Social Media
What Is Engagement on Social Media?
When it comes to social media marketing KPIs, engagement often matters more than reach or impressions because it shows how users are actively interacting with your posts across different social channels.
Engagement metrics do not represent a single action. Instead, they include multiple forms of interaction, such as:
- How often users click through to your product page or related website.
- The number of times your posts are shared.
- The number of comments your posts receive.
- Clicking the call-to-action (CTA) button on a post.
- Clicking annotation links to move to the next stage of the conversion journey.
Neither impressions nor reach guarantees that users are actually paying attention to your content. Engagement metrics, however, indicate whether users are reacting to your posts and taking action after viewing them.
Engagement also helps you understand whether your content resonates with your audience. You can evaluate how well your audience interacts with your posts by conducting A/B testing on different content formats. Based on these insights, you can optimize your content to drive more clicks, shares and boosts for improved performance.
The higher the engagement, the greater the potential for lead generation and conversions. By analyzing engagement metrics, you can effectively determine the success of your marketing goals.
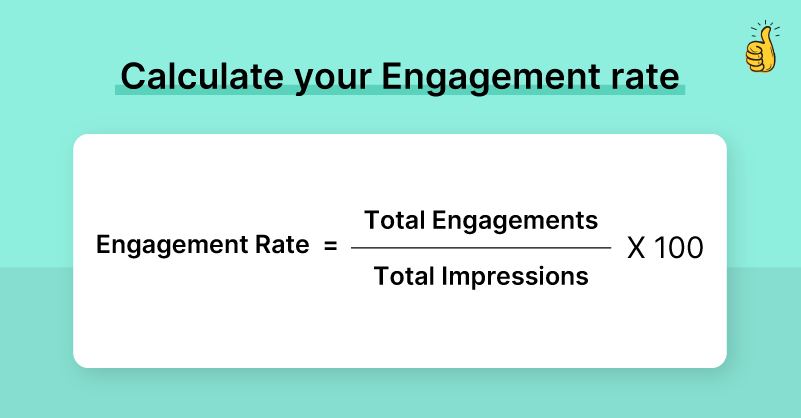
The Formula for Calculating Engagement Rate on Social Media
Impressions vs. Reach vs. Engagement: What’s the Difference?
This is the much-awaited part. When you look at social media reach vs impressions vs engagement, everything may seem similar at first. However, each of these metrics plays a unique role in measuring social media performance effectively. Understanding the differences between them helps you gain clearer insights into how your content is performing.
Let’s explore this more clearly with engagement vs reach vs impression examples from some of the most popular social media platforms, such as Facebook, Instagram, LinkedIn and YouTube.
Instagram Creator Account Post
Let’s say you shared a reel. How do you analyze reach vs impression on Instagram?
- Reach: 500 unique users viewed the post.
- Impressions: 1,200 total impressions were generated from those 500 users. Impressions are higher than reach because some users saw the reel more than once in their feed or on the Explore page.
- Engagement: Engagement is calculated based on total interactions, including 95 likes, 12 comments, 8 shares and 20 profile clicks.
Impressions vs. Reach vs. Engagement: What’s the difference?
Many users saw the post multiple times, which increased impressions, but only those who liked, commented, shared or clicked contributed to engagement. Together, these metrics help you evaluate the overall performance of your post.
Facebook Business Page Promotion
Let’s say you publish a promotional post and analyze reach vs impressions on Facebook.
- Reach: 1,000 people have actually opened or played the post.
- Impressions: 1,500 times the post appeared on screens. This doesn’t mean it’s been watched 1500 times.
- Engagement: 60 times the audience have clicked the link or CTAs, 25 reactions and 10 comments.
Impressions vs. Reach vs. Engagement: What’s the difference?
Even though it looks like the post appeared frequently on the viewers screen, the engagement only gives a clear picture of how many people actively interacted with your content, instead of just scrolling past.
LinkedIn Carousel Post for Product Visibility
Let’s say you shared a carousel post to analyze impressions vs engagement on LinkedIn.
- Reach: 300 professional audience saw your LinkedIn post.
- Impressions: 450 total appearances on the audience screen.
- Engagement: 18 likes, 6 comments and 12 link clicks achieved overall.
Impressions vs. Reach vs. Engagement: What’s the difference?
The number of reach achieved shows how many unique users were exposed to the post, impressions show repeated visibility and engagement reflects the steps taken by the audience for impactful connection.
YouTube Shorts Video
Let’s say you posted a YouTube Shorts.
- Reach: 2,000, which means your audience has just seen your video thumbnail on YouTube.
- Impressions: 3,500 times the thumbnail was visible to the audience, like on Home feed, Search results, Suggested videos on YouTube.
- Engagement: 220 likes, 45 comments, 120 shares and 300 minutes of total watch time.
Impressions vs. Reach vs. Engagement: What’s the difference?
The thumbnail of the video itself might appear multiple times to the same user, increasing impressions. Engagement reflects how viewers interact with your video, showing their interest through likes, comments, shares, or watch time and reach says how many have actually viewed your video.
How to Track Social Media Metrics Effectively
By now, you should have a clear understanding of how social media metrics affect your blog’s performance. Consider these points and the example above, which explains how to evaluate social media metrics effectively.
Here are some guiding steps that can help you track, monitor, measure and analyze them effectively.
- Never fail to track your reach, impressions and engagement using in-depth analytics.
- Try using comprehensive social media management tools that offer platform-specific metrics, which the usual analytics provided by the platforms themselves often fail to cover.
- Gather performance reports every 10 days, 20 days or monthly and compare them with quarterly and annual reports to evaluate how your content has been performing over time.
- Never leave out any of the metrics or focus solely on one; only by monitoring all three together you can gain a clear picture of your reach vs engagement.
- Don’t optimize your strategy randomly; always base your optimization on social media metrics reports to understand what works and what doesn’t.
It’s Time to Take Data-driven Decisions Instead of Relying on Guesswork!
Reach vs impressions vs engagement are highly interdependent. Tracking these metrics helps you analyze brand awareness and brand authenticity more effectively. When planning social media promotions and working toward your goals, these are metrics you simply cannot ignore.
No more random strategies or guesswork, make data-driven decisions to save time and achieve your goals without unnecessary effort.
We’re happy to have guided you. Get in touch with us for more social media management-related content, and stay tuned with GudSho Social!
![]() Srinivasan is a Digital Marketer and Blogger with a passion for video marketing solutions and video hosting platforms. He is committed to sharing the latest tech trends, social media management tools ideas and enjoys discussing new technologies, along with helpful tips and tricks. An avid reader, He loves to share his insights with others.
Srinivasan is a Digital Marketer and Blogger with a passion for video marketing solutions and video hosting platforms. He is committed to sharing the latest tech trends, social media management tools ideas and enjoys discussing new technologies, along with helpful tips and tricks. An avid reader, He loves to share his insights with others.